

Gold (XAU/USD) – Repeated Attempts at a Fresh All-Time High, US Retail Sales Weigh
Gold continues to test, and reject, its previous all-time high at $2,485/oz. and a break higher is being pared by a strong US retail sales report
- Gold unable to break higher as resistance holds firm.
- Weekly net-short positions jump.
Recommended by Nick Cawley
Get Your Free Gold Forecast
Gold is coming under pressure after the release of a stronger-than-expected US retail sales report. Expectations of a 50 bp rate cut have been pared back – from 38% to 25% – while expectations of a smaller 25 basis point cut have been boosted from 62% to 75%.
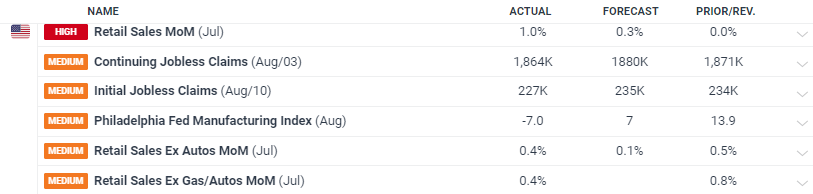
For all high-importance data releases and events, see the DailyFX Economic Calendar
Gold continues to test the mid-July all-time high at $2,484/oz. and is likely to do so again but slightly further out. The daily chart remains technically bullish – short-term higher lows and supportive simple moving averages – with initial support off the 20-dsma at $2,417/oz. followed by $2,400/oz. A break below $2,380/oz. would negate the short-term bullish outlook.
Gold Price Daily Chart
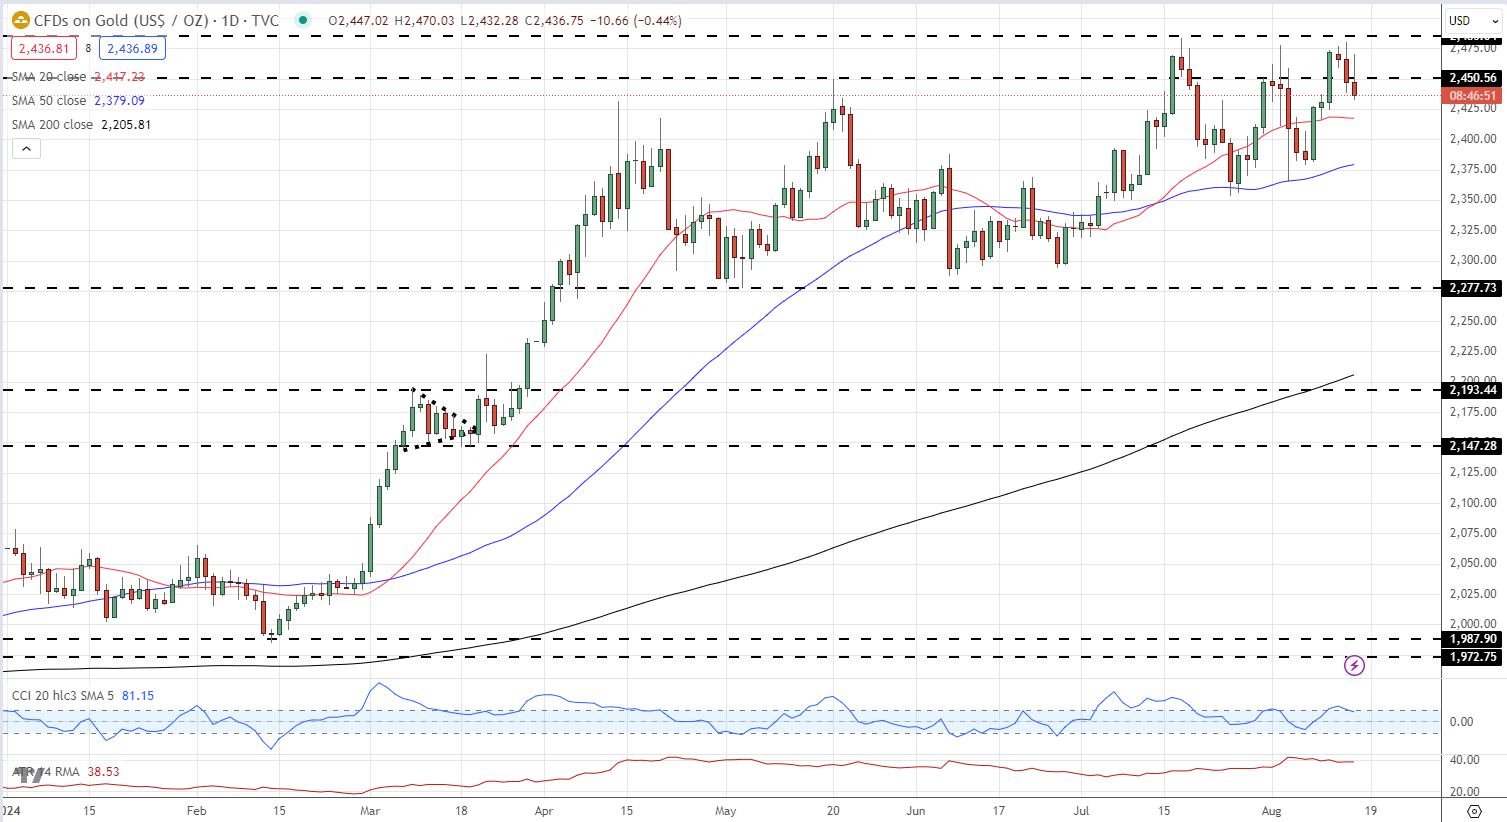
Chart via TradingView
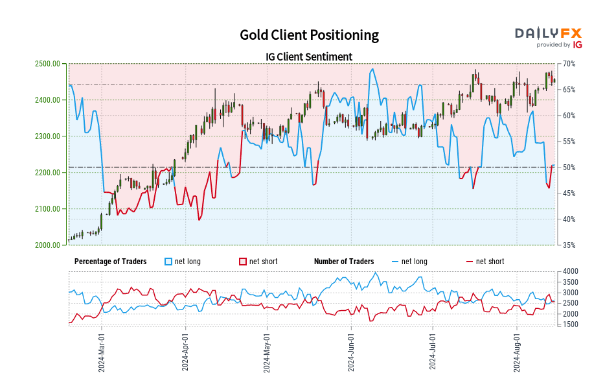
Retail trader data shows 50.72% of traders are net-long with the ratio of traders long to short at 1.03 to 1.The number of traders net-long is 8.89% higher than yesterday and 13.18% lower than last week, while the number of traders net-short is 9.63% lower than yesterday and 34.51% higher than last week.
We typically take a contrarian view to crowd sentiment, and the fact traders are net-long suggests Gold prices may continue to fall. Positioning is more net-long than yesterday but less net-long from last week. The combination of current sentiment and recent changes gives us a further mixed Gold trading bias.
| Change in | Longs | Shorts | OI |
| Daily | 5% | 4% | 5% |
| Weekly | 12% | -9% | 1% |
What is your view on Gold – bullish or bearish?? You can let us know via the form at the end of this piece or contact the author via Twitter @nickcawley1.
